
Online Reporting - feature photo

Interact and interpret your data

Our reports contain charts, metrics, video and a 3D viewer. Playback is synchronized and a time indicator in the charts help you know exactly which part of a movement you are looking at.

Interactively explore or present your data: Switch charts to display mean curves or all movement cycles, overlay left and right body side to check symmetry or select/de-select trials – the algorithms that are built into the report ensure that all data you see is up-to-date and re-calculated as required.

Online Reporting - feature photo

Report Center

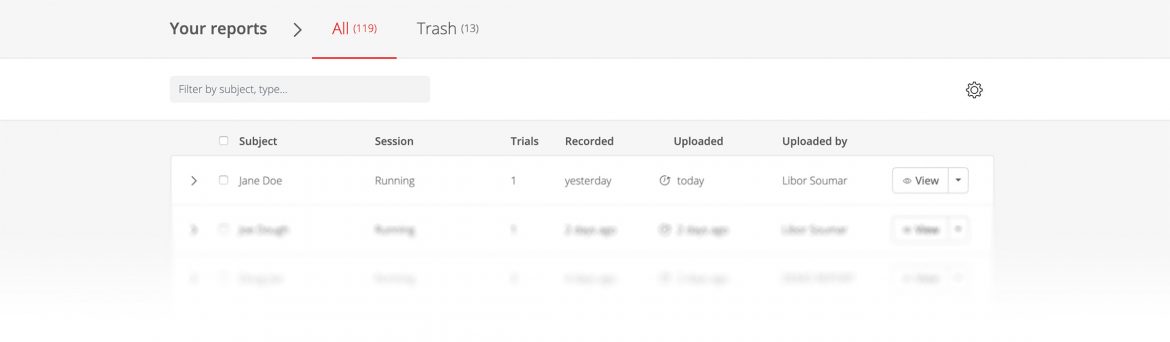
Log in to your organization’s Report Center to search, view, edit and share your reports. See revision history and which reports include comparisons to previous sessions.

Online Reporting - feature photo

Cloud Biomechanics

Calqulus is Qualisys’ unique online processing engine that provides all of the calculations for data capture, analysis, and reporting in the cloud with no additional software required for processing. Not only does this save time and money, but it is also incredibly reliable and secure.

It offers a range of pre-made, open-source pipelines – a one-stop-shop for all your desired sport analyses bundled into a single module, including Running, Cycling, Baseball, Cricket, Functional Assessment, and a generic pipeline. Collect in QTM using the Qualisys Sports Marker Set and process with the click of a button. Processed data can then be viewed and shared from the online Report Center. Inverse Dynamics for the lower limbs and EMG data can also be collected and processed to display Kinetics and EMG parameters alongside Kinematics parameters in the Web Report.

With Calqulus, data can also undergo cloud-based processing, enabling users to reprocess their data and reports from anywhere with an internet connection.

Secure storage

Your data is stored on servers complying to major security frameworks (ISO 27001, HIPAA, GDPR). Protected health information and personal information are encrypted both at rest and in transit. And certainly, we will never give your data to a third-party.

Cross-platform

Reports can be viewed with all major web browsers, no matter if you are using PC, Mac, Linux or mobile devices. No need for you, your collaborators or customers to install software or to have Administrator rights on the device.

Markerless data in your web reports

Use Miqus Video Plus or Hybrid cameras to calibrate and capture in QTM, while your preferred markerless processing engine handles the participant’s skeleton tracking. Choose between Prisma Pose, our native markerless engine that runs inside QTM, or Theia Markerless.

Markerless data skeleton data from Prisma Pose or Theia Markerless processes through Calqulus and Visual3D to land in the same Qualisys online reports you are used to. Markerless analysis is supported for select modules and requires either a Prisma Pose license for QTM or Theia Markerless processing software to generate results onto the web report.

Refer to the table for an overview of the available analysis modules and processing solutions.

SupportedNot available
Marker-based Markerless True
Hybrid2
Calqulus Visual3D Theia3D Prisma Pose
Gait Analysis1
Functional Assessment
Running
Cycling
Golf ✓
Baseball/Softball Pitching
Baseball/Softball Hitting ✓
Cricket Bowling
Cricket Batting ✓

1Gait for markerless analysis is for research use and is not part of the Qualisys Clinical System’s clinical use.

2True hybrid capture is possible using 8+ Qualisys video cameras for markerless body tracking and 4-6 Qualisys marker-based cameras for object tracking

Tap to watch

Interactive report

Toggle between showing means or all curves to see your client’s consistency. Check symmetry by overlaying left and right charts and select/de-select trials – the reports update on the fly.

Tap to watch

Export to PDF

Export to PDF for printing or archiving in your own record system. Choose between A4 and Letter size.

Tap to watch

View synchronized data

See charts, video and the 3D visualization in one place and in sync during playback. Enable “playheads” to highlight the current position in all your charts.

Tap to watch

Annotate data

Use annotations to highlight features in any of the charts, then group them and add your advice. Or simply type text into a comments box – your comments will be saved directly in the report.

Tap to watch

Compare sessions

Compare up to four existing sessions in a comparison report. This is commonly used for pre-/post-intervention comparisons or to compare different people.

Tap to watch

Share reports

Sharing reports is as simple as generating a secure link. Copy this link into an email or any other type of message to share it with collaborators or your client.

Tap to watch

Custom reference data

Select any set of web reports in the Report Center to create your own reference data sets directly in the cloud.


Tap to watch

Report Center search

Filter by ID, name or other fields to enhance your search results in Report Center.


Tap to watch

Expand graphs

“Pop out” any of the charts to take a closer look at the data.


Free

Free

Basic

$

Premium

$$

Enterprise

$$$

Report Storage1 10 100 1000 10000
Student (Guest)
Report Storage
5 50 100 100
Calqulus Engine + + + +
Calqulus Reports
Starter Package2
+ + + +
PDF Export – + + +
Custom Reference Data – + + +
Set Preferred Data Center Location3 – – – +


1 It is possible to free up storage by deleting reports.
2 Includes Baseball, Cricket, Cycling, Functional Assessment, Generic, Functional Assessment, and Running reports
3 Enterprise can choose from Europe or Canada. All other subscription levels default to Europe. Contact us to request other locations.